
X-RAY RUNS: Apply for Beamtime
2017 Nov 1 - Dec 21
2018 Feb 7 - Apr 3
2018 Proposal/BTR deadline: 12/1/17
2018 Apr 11 - Jun 4
2018 Proposal/BTR deadline: 2/1/18
![]()
Contact: E. Fontes (ef11@cornell.edu)
Not a single biologist, chemists or physicist would use synchrotron radiation sources if not for high-quality optical elements that select, shape, and focus high-power, high-intensity x-ray beams onto their specimens. The challenge for the optics engineers, however, is providing the necessary dispersion and focusing all while dissipating the intense raw power in the full white beam. At the extremes, modern insertion devices driven by high energy particle beams produce x-ray broadband power densities equal to those produced by arc welders!
While it has long been possible to use Infra-Red cameras to record the elevated temperatures of crystals and mirrors being hit by synchrotron beams, it has not yet been possible to image the actual physical distortions of the mirror surfaces or diffraction planes. Heated surfaces expand and the so-called “thermal bumps” cause x-ray beam divergences to grow and peak photon intensities to drop, and contribute in general to degrading of the longevity and performance of optical elements and beamlines. There are several techniques, based on visible light interferometry, to measure surface profiles and microscopic roughness very accurately, though it has not yet been possible to extend these instruments to record in-situ three-dimensional topographs of the synchrotron beam footprint. Likewise, well-established methods can show degraded performance of optics via broadened rocking curves or expanded beam sizes. These methods provide a true measure of performance degradation but do not record directly the thermal footprint of the beam.
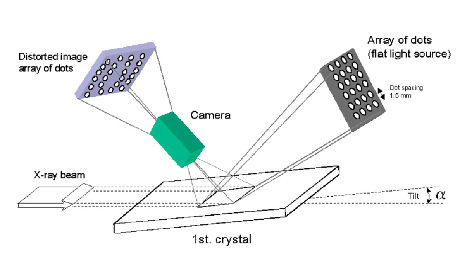
Figure 1: Schematic of video camera recording an image of the
array of dots. A thermal bump on the crystal
surface will distort the array, and the resulting dot
displacements can be used to reconstruct the surface
profile.
Recently, three scientists at CHESS devised a new method to view surface distortions under direct synchrotron heating. The method was just published in a paper entitled “In-situ visualization of thermal distortions of synchrotron radiation optics,” by Peter Revesz, Alexander Kazimirov and Ivan Bazarov, in Nuclear Instruments and Methods in Physics Research A 576 (2007) 422–429. They use a fairly standard video camera to record an image of a regular array of dots. The camera sees at the array of dots after a single reflection of the image from the surface of the x-ray optic. When the high-power synchrotron beam hits the optic, the surface develops a “thermal bump” and the image of the dots becomes distorted. The displacements of the dots from their “cold” positions can be used to build a gradient vector map of the heated surface – somewhat similar to distorting a pin cushion. Mathematically inverting the gradient field into a bump elevation plot is the heart of the new method.
In experiments performed at the CHESS A2 wiggler beamline, they measured heat bumps with heights up to 600 nanometers. The wiggler source provided heat loading in the range of 15–60W incident on the (111) Si crystal at various angles between 3 and 15 degrees. The crystal was attached to a water-cooled copper substrate covered by liquid Indium for better thermal contact. During the experiment the crystal angle and aperture settings were varied to explore the effects of different power densities hitting the crystal. An Astrovid CCD camera was mounted outside the vacuum box housing the silicon monochromator crystals and peered through a quartz viewport to focus on the reflected image of an array of 20 by 30 dots. The change in position of each dot was tracked using a home-built software package that analyzed each captured frame and calculated the (x, y) position coordinates based upon center-of-gravity calculations.
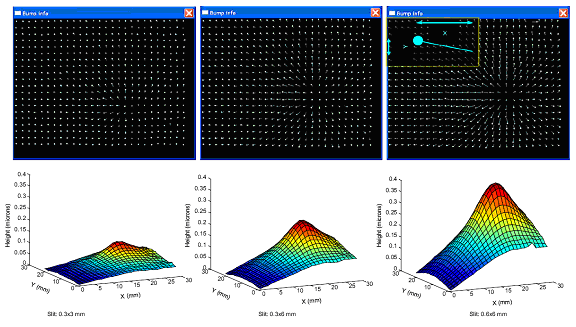
Figure 2:
X-ray beam hitting a crystal tilted 5 degrees, for three
different slit openings (as indicated). On top,
the dot patterns recorded by the video camera; the
length of the line indicates the displacement of the dot
versus no x-ray beam. Below, the reconstructed
crystal surface profiles show displacements up to 400
nanometers.
Recovering the true 3-dimensional heated surface from the experimentally measured gradient map is challenging. The straightforward process of simply integrating all the difference vectors to produce the surface displacement map leads to erroneous results prone to measurement noise and depending on the path taken during the integration process. These authors show, however, that when a more sophisticated matrix algebra method is used to reconstruct the surface the propagation of experimental errors can be minimized. In particular, they show how the Poisson method with Neumann boundary conditions can recover the surface profiles of the reflecting crystals or mirrors. This technique is now being used for detailed analysis of the heat-bump formation in crystals and multilayer optics with a goal towards optimizing optics performance for flux and brilliance preservation.