
X-RAY RUNS: Apply for Beamtime
2017 Nov 1 - Dec 21
2018 Feb 7 - Apr 3
2018 Proposal/BTR deadline: 12/1/17
2018 Apr 11 - Jun 4
2018 Proposal/BTR deadline: 2/1/18
A recent collaboration with geologist Alaura Singleton, from Dr. Gordon Osinski’s research group at Western University in London Ontario (Canada), and CHESS scientists Matthew Ward, Arthur Woll, and Margaret Koker, has utilized the new CHESS Maia detector to perform full spectrum iron K-edge x-ray absorption mapping experiments on impact melt bearing breccias. Melt bearing breccia samples were taken from the Mistastin impact structure, which was formed by a meteorite impact in Northern Labrador, Canada ~36 million years ago. Alaura is using XANES mapping to determine the phase and oxidation state of iron in glass clasts within the melt and in the surrounding matrix to determine the possibility of inclusion of meteoritic material in the melt. The Maia allows us to rapidly produce large area – full spectrum XANES maps, taking advantage of 384 tightly packed Si detector elements in a backscattering geometry to collect a massive solid angle of the emitted fluorescent x-rays.
Figure 1 shows an XRF maps (top pane) of a large clast within the impact breccia taken with an x-ray excitation energy above the iron K-edge (7.112 keV) with a spatial resolution of 40 um. Full range XANES mapping, from 7.05 keV to 7.3 keV, was performed on the entire area, 3.6mm x 5.5mm, of the XRF map with an integration time of 15 ms per pixel, taking less than 8 hrs to produce the entire XANES image stack. XANES spectra extracted from different spots inside the clast and in the breccia matrix are shown in the graphs of Figure 1. From XANES extracted at different spots within the clast (spot 1&2) we can see that iron exhibits a homogenous phase distribution across the clast. It is clear from the XANES that iron in the host matrix (spot 3&4) exhibits a different phase than iron within the clast (spot 1&2).
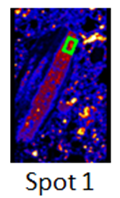
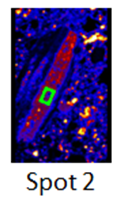
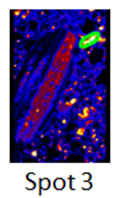
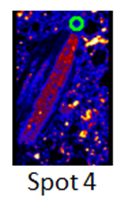
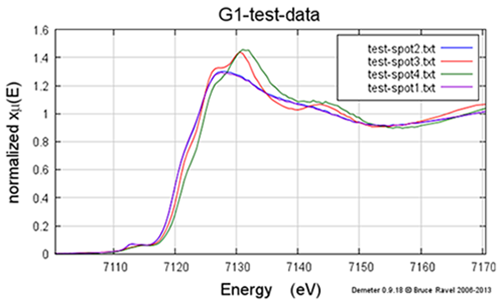
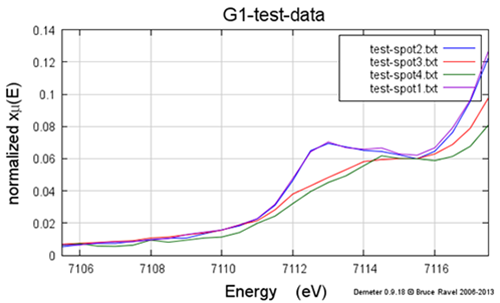
Figure 1: Fe K-edge XANES spectra (top graph) taken from 4 spots (top pane) on an impact melt bearing breccia sample, two from within a melt clast and two from the breccia. Expanded view of pre-edge region (bottom graph), which is sensitive to Fe2+ and Fe3+ contributions to the XANES.
While a detailed analysis of this data is still in progress, it is already clear that the MAIA detector gives CHESS a tool to rapidly create exciting and thought provoking fluorescence and spectroscopic images.
Submitted by: Matthew Ward, CHESS, Cornell University
12/15/2014