X-RAY RUNS: Apply for Beamtime
2017 Nov 1 - Dec 21
2018 Feb 7 - Apr 3
2018 Proposal/BTR deadline: 12/1/17
2018 Apr 11 - Jun 4
2018 Proposal/BTR deadline: 2/1/18
In March of this year, CHESS commissioned the Maia detector, a 384-pixel, energy-dispersive pixel array detector for x-ray fluorescence-based applications, especially XRF imaging. Further commissioning activities and initial user science took place in June at bend-magnet station F3. General user science with the Maia detector began in earnest in October, in conjunction with a 48-hour workshop on the Maia detector and the software analysis package GeoPIXE. Twelve workshop attendees from eight unique user groups spent a day and a half reviewing critical XRF concepts and gaining hands-on experience with data analysis, accessing GeoPIXE on the central compute farm via their own PCs. Six of these groups were from outside Cornell, and only two groups had previously used CHESS.
On the second day, each user group received short, 1.5-hour time blocks at the F3 station to take data on their own samples. A single-bounce monocapillary optic (fabricated at CHESS) was used to define a 20-micron-diameter incident beam which, in turn, determined the minimum spatial resolution of the images that could be obtained. In addition to these 1.5-hour blocks, five groups submitted special user proposals for up to 24 hours of beamtime during the subsequent week. Obtaining hands-on experience immediately following the classroom activities helped participants solidify basic aspects of the data acquisition and analysis specific to CHESS. It also provided a chance to perform feasibility measurements on samples or systems that have not been previously subjected to XRF mapping. These sorts of measurements often form the basis of formal proposals in new areas of study, but can be difficult to obtain.
Workshop participants represented a wide variety of scientific fields, including cultural heritage, materials science, biology, and geology, and brought a correspondingly broad array of different samples to visualize with the Maia detector. As an example, figure 1 shows Cornell graduate student and workshop participant Louisa Smieska who, working in conjunction with fellow graduate student Fredrika Loew, obtained an elemental composition map of an extremely rare object from Cornell’s rare and manuscript collection. The object is a piece of petrified reed, thought to be over 2 million years old, on which are several lines of Arabic text. The text is thought to be written near 800 C.E., but trace element analysis of the ink may help determine this date with greater certainty.
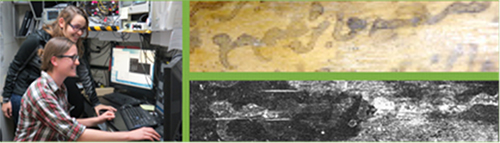
Figure 1: Cornell graduate students Fredrika Loew and Louisa Smieska examine the trace-element composition of ink used to write Arabic text (tentatively dated to 800 C.E.) on a piece of petrified reed. The reed (top right) is thought to be over 2 million years old, and is nearly if not wholly unique. It was recently found in Cornell’s rare and manuscript collection. Lower image shows a 40 x 8 mm2 map of the iron distribution on a small portion of the reed, obtained with 0.02-mm resolution with the Maia.
Figure 2 represents XRF results from a series of 5 geological samples brought by workshop participant Neil Banerjee, Associate Professor of Earth Sciences at the University of Western Ontario. His group has previously used XRF mapping and XANES capabilities at several synchrotron beam lines to map micron-scale associations and redox state of trace metals (e.g., As, Cu, Zn, Ni, Te, Se) in pyrite grains and associated gold. These images, obtained from three, 2.8 billion-year-old gold deposits in Northern Canada, show variability in mineralogy that are related to differences in gold mineralizing mechanisms. The Maia detector allows collection of trace element associations with gold at unprecedented speed and over larger areas. The data in figure 2 were collected in a single scan over the course of several hours. In future runs, such scans might be followed up by XANES or XAFS-maps obtained from smaller regions of interest identified by the large-area scan.
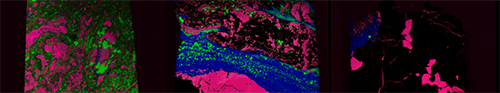
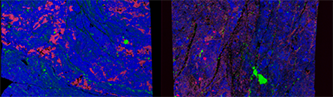
Figure 2: False color representation of Calcium (red), Iron (green), and Potassium (blue) distributions in five rock samples (each approximately 1” x 1” in size) obtained from across Northern Canada. Samples were scanned by workshop participants Neil Banerjee (University Western Ontario) and Lisa van Loon (Canadian Light Source).
Among the most striking images obtained during the workshop came from an unlikely source: a fairly colorless pressed, dried shrimp (see figure 3) brought by several collaborating researchers from New York State Department of Health’s Wadsworth Center, and the University at Albany School of Public Health. This collaboration is led by Patrick Parsons at the Wadsworth Center’s Laboratory of Inorganic and Nuclear Chemistry and focuses on the many impacts of natural and man-made environmental factors on human health. The image in figure 3 represents an unprecedented capability for visualizing and focusing in on the amount and distributions of potentially harmful substances in our environment, food supply, and physiology. Although the image shows only harmless substances, the approach is particularly sensitive to toxic elements such as Mercury, Arsenic, and Lead.
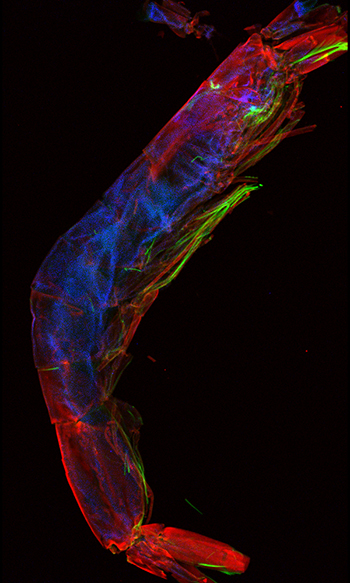
Figure 3: Elemental distributions of Calcium (red), Bromine (green) and Zinc (blue) in a dried, pressed shrimp (approximately 0.5 cm x 2 cm in size), and brought to the workshop by Diana Guimarães Guedes, and Aubrey Galusha and Mina Tehrani, representing the New York State Department of Health’s Wadsworth Center and the Department of Environmental Health Sciences at the University at Albany School of Public Health.
Although the image in figure 4 looks strikingly like a prototypical color wheel, it in fact represents the distribution of Bismuth, Platinum, and Iridium in a so-called “composition-spread film,” scanned by graduate students Marc Murphy and Bin Wang (http://news.chess.cornell.edu/articles/2013/Vlassak04232013.html, http://news.chess.cornell.edu/articles/2011/emcc040511.html), members of Bruce van Dover’s group in the Cornell Department of Materials Science and Engineering. Such films represent an efficient solution to the incredibly complex problem of searching for new functional compounds among the infinite combinations of different elements in the periodic table. As is, the image in figure 4 provides an efficient, quantitative check that the deposition system is working as designed. When combined with advanced spectroscopic techniques such as XANES and EXAFS, such maps will provide rich detail regarding the actual compounds that form from these different ratios of constituent elements.
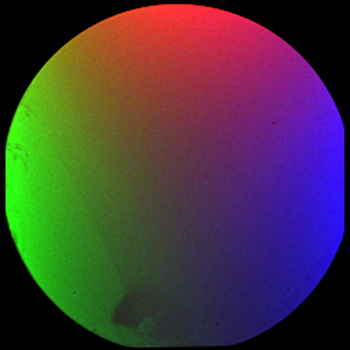
Figure 4: Elemental distributions on a three-component, composition-spread thin film on a 3”-diameter silicon wafer. The film is deposited with spatially-varying thicknesses of Bismuth (red), Iridium (green), and Platinum (blue) in order to efficiently study solid-state compound formation as a function of deposited stoichiometry. Sample was scanned by workshop participants Marc Murphy and Bin Wang, both members of Bruce van Dover’s research group in the Cornell Department of Materials Science and Engineering.
Inquiries about XRF mapping and spectroscopy with the Maia detector at CHESS should be directed to Arthur Woll (arthurwoll@cornell.edu) or Rong Huang (rh66@cornell.edu).
Submitted by: Arthur Woll, CHESS, Cornell University
12/12/2014