X-RAY RUNS: Apply for Beamtime
2017 Nov 1 - Dec 21
2018 Feb 7 - Apr 3
2018 Proposal/BTR deadline: 12/1/17
2018 Apr 11 - Jun 4
2018 Proposal/BTR deadline: 2/1/18
X-rays have long been the world-leading tool for crystallography, which allows researchers to make highly accurate atomic-scale maps of the perfect repeating structures that occur in crystals. However, amorphous materials (like glass) lack this perfect repetition, and are therefore much harder to understand with atomic precision. Now, researchers from Canadian Universities in Guelph, North Vancouver and Montreal have invented a new intuitive computational technique [1] to construct three-dimensional statistical density maps from synchrotron x-ray diffraction, to directly visualize local atomic structure of amorphous germanium (a-Ge), enabling the interpretation of recent state-of-the-art experiments[2]. By visualizing the local structures using local atomic motifs (LAMs) (figure), they show qualitative and quantitative structural differences between the continuous random network (CRN) model and an adjusted model arrived at by a Reverse Monte Carlo (RMC) method. This novel visualization tool enables the interpretation of complex disordered materials and reveals the bimodal structures of a-Ge.
The structural description of even the most basic monatomic amorphous materials is under considerable debate. This new method preserves information about the small local variations in structure inherent in amorphous materials rather than categorizing structures according to their similarity to related crystalline structures. This visualization approach can be widely applied to unlock the structural solutions of other systems; from long-range disorder in periodic structures to local order in amorphous and liquid structures.
To capture information about very small displacements of atoms inside the unit cell required a high-energy x-ray beam and a diffractometer capable of going out to unusually high angles. The CHESS A2 station is able to carry out high-resolution powder diffraction to near backscattering at up to 70 keV, with a variety of detectors available to optimize for collection speed or precision. The combination of the PDF technique with the powerful new LAM analysis method offers a powerful analytical tool which will advance the field of amorphous structure determination.
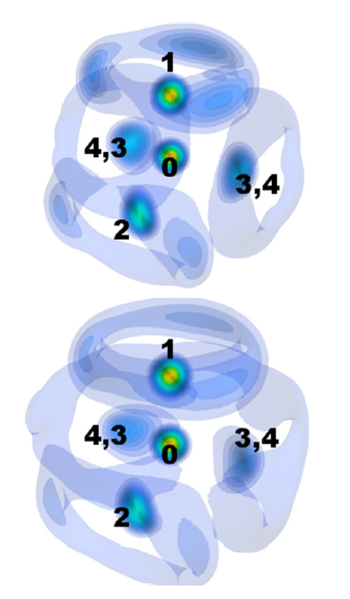
Gaussian-smoothed 3D atomic density contour plot of the 17 atom LAMs for the CRN model (top) and the refined model (bottom). Each LAM is presented as a stereogram for 3D visualization in the publication. Sharper contours correspond to higher densities. Animated rotations of each contour plot are shown in supplemental videos 1 and 2 respectively of the Supplemental Materials.
References:
[1] B. Tomberli, A. Rahemtulla, E. Kim, S. Roorda, and S. Kycia, "Germanene-like defects in amorphous germanium revealed by three-dimensional visualization of high-resolution pair-distribution functions," Physical Review B 92 (6), 064204 (2015).
[2] S. Roorda, C. Martin, M. Droui, M. Chicoine, A. Kazimirov, and S. Kycia, “Disentangling Neighbors and Extended Range Density Oscillations in Monatomic Amorphous Semiconductors.” Phys. Rev. Lett. 108, 255501 (2012)
Submitted by:
Ernest Fontes and Jacob Ruff, CHESS, Cornell University
12/10/2015